If you are a programmer and know any programming language, you will know memory leak and how it occurs. Here we will talk about python memory leaks.
Do you want to know when we face the memory leak in python?
If not, don’t panic, I will tell you all about that.
A memory leak occurs when a programmer forgets to clear a memory allocated in heap memory. You can consider it as wastage or a type of resource leak.
Memory leaks in any application affect the machine’s performance, and it becomes alarming when developing applications on a large scale.
If you want to know more about memory leak in python, keep scrolling on this blog.

What is a Memory leak in Python?
Table of Contents
When we talk in simple language, a memory leak is the inappropriate management of memory allocation. When the unneeded memory isn’t released, a computer program fails to manage the memory allocations. Because of this failure, unused objects start to pile up in the memory that causes a memory leak.
A memory leak can not always pop up in the production of a program. There are several reasons for memory leak in python code, such as one might not get sufficient traffic, frequently deployed, no uses of hard memory, and much more.
Top 10 Reasons of memory leak in Python
Python programs experience memory leaks like other programming languages. In Python, three factors are there that cause a memory leak.

- Circular references: It is the first reason behind the python memory leak. Circular references create when two objects refer to each other and prevent the garbage collector from freeing up the memory.
- Uncollected objects: The uncollected objects are another biggest reason for the python memory leak issue. If all the objects are made, but the garbage collector never gathers them, it will eventually lead to a memory leak issue.
- Referencing global variables: If you are referencing global variables, then it’s causing the issue of python memory leak. Global variables persist throughout the program’s lifetime, and if they reference objects, they can leak memory.
- Holding onto old objects: If they are not properly cleared, they consume memory.
- Improper use of Generators: A memory leak occurs if you improperly use the generators. Therefore, you should use the generators carefully because they can hold onto the entire contents of a large data set, showing memory leaks.
- Unclosed file handles: If they are not closed properly, they can cause a memory leak as the memory used by the file remains allocated.
- Database connections: If they are not appropriately closed, they can cause memory leaks.
- 3rd party libraries: It is another reason for memory leaks in python. If 3rd party libraries are not written properly, they can cause memory leaks.
- Memory-hungry algorithms: Some algorithms are designed to consume a lot of memory, causing memory leaks issues if all the algorithms are not managed properly.
- Multithreading: In a multithreaded program, if one thread creates an object and another thread holds a reference to it, the garbage collector may not be able to collect the object, leading to a python flask memory leak.
In general, it’s important to be conscious of python memory management and use tools like ‘pympler’ or ‘objgraph’ to monitor and diagnose memory leaks in Python.
Some Other Reasons For Memory Leak In Python
Here are the following causes of memory leak in python.
Unreleased Large Objects Lingering In the Memory
When the domain controller fails to replicate for some time longer than the tombstone lifetime, lingering objects occur. If the domain controller is offline and you remove an object from the active directory service, the object stays as a lingering object in the domain controller. These objects consume space loading to the occurrence of memory leaks.
Code’s Reference Styles
Different types of references are used in code referencing, with the additional capabilities to collect garbage. The referencing style would evaluate the memory leak in Python, and the program with a strong reference makes it hard to collect garbage. So when these objects pile up, it results in memory leaks.
Underlying Libraries
For visualization, data processing, and modeling, python uses multiple libraries. Hence such libraries make the python data task much easier; as a result, they link to the memory leaks.
What Is Python Memory Management?
Python prepares memory management at its individual level, and this is entirely extracted from the user. It usually does not require understanding how this can be done within, but while operators are going, one must understand it.
When some primitive classes of an article work out of range or remove it with del explicitly, the memory does not deliver back to the OS, and it could still be considered for the python method. The presently free things could move to an idea known as free list and would always remain on the heap. The memory leak in Python can be realized only while a garbage collection of the most critical generation occurs.
Here we have allocated the file of ints and removed it explicitly.
import os, psutil, gc, time
l=[i for i in range(100000000)]
print(psutil.Process(os.getpid()).memory_info())
del l
#gc.collect()
print(psutil.Process(os.getpid()).memory_info())
The Output would seems as:
# without GC:
pmem(rss=3268038656L, vms=7838482432L, pfaults=993628, pageins=140)
pmem(rss=2571223040L, vms=6978756608L, pfaults=1018820, pageins=140)
# with GC:
pmem(rss=3268042752L, vms=7844773888L, pfaults=993636, pageins=0)
pmem(rss=138530816L, vms=4552351744L, pfaults=1018828, pageins=0)
Observe it by removing, and we are moving from 3.2G -> 2.5G, but several kinds of stuff (frequently int objects) extending throughout the heap. If one also triggers it with a GC, it works from 3.2G -> 0.13G. Therefore its memory did not return to the OS till a GC was the trigger. It is just a concept of how Python can prepare memory management and how to fix memory leak in Python.
How To Fix Python Memory Leak Issue?
These are the following methods to fix the python memory leak issue.
Methods To Confirm Whether There Is A Memory Leak In Python Or Not
With the help of a basic understanding of how memory leak in python and how python memory management works, we used specific GC (garbage collection) with the particular answer that was sent back. This will be like this:
@blueprint.route(‘/app_metric/<app>’)
def get_metric(app):
response, status = get_metrics_for_app(app)
gc.collect()
return jsonify(data=response), status
Memory was yet steadily growing with traffic even with the GC collection. Suggesting?
THIS IS A LEAK!!
Initiate With Heap Dump Method
So we ought to see this uWSGI operator with large memory allocations. One might not be informed of a memory profiler that can connect to a moving python method and provide real-time object utilizations. That is why a heap dump continues to examine what all is present there. Here is the method for how it could be done:
$> hexdump core.25867 | awk ‘{printf “%s%s%s%s\n%s%s%s%s\n”, $5,$4,$3,$2,$9,$8,$7,$6}’ | sort | uniq -c | sort -nr | head
123454 00000000000
212362 ffffffffffffff
178902 00007f011e72c0
168871
144329 00007f004e0c70
141815 ffffffffffffc
136763 fffffffffffffa
132449 00000000000002
99190 00007f104d86a0
These are the values of symbols and address the mapping of those symbols. To understand what these objects are actually:
$> gdb python core.25867
(gdb) info symbol 0x00007f01104e0c70
PyTuple_Type in section .data of /export/apps/python/3.6.1/lib/libpython3.6m.so.1.0
(gdb) info symbol 0x00007f01104d86a0
PyLong_Type in section .data of /export/apps/python/3.6.1/lib/libpython3.6m.so.1.0
Let’s Follow The Memory Allocation Methods
There are no other alternatives that can track memory allocations or memory leak in Python. Several python projects are accessible to support the learners’ memory allocation. But one requires to be introduced individually, and as 3.4 python appears bundling trace malloc.
It follows memory allocations and shows a module/line where an object could be designated with volume. One can use pictures at irregular duration in the program track and examine the memory distinction among these two spots.
This flask app is assumed to be stateless, and it must not be hard memory allocations within API requests. Therefore how does one get a picture of memory and follow memory allocations within API requests, which is stateless?
The best thing one can do for memory leak in Python is to come up with: Transfer a doubt factor in an HTTP call that can catch a picture. Transfer various factors that can help to take the different pictures and match them with the original one!
import tracemalloc
tracemalloc.start()
s1=None
s2=None
…
@blueprint.route(‘/app_metric/<app>’)
def get_metric(app):
global s1,s2
trace = request.args.get(‘trace’,None)
response, status = get_metrics_for_app(app)
if trace == ‘s2’:
s2=tracemalloc.take_snapshot()
for i in s2.compare_to(s1,’lineno’)[:10]:
print(i)
elif trace == ‘s1’:
s1=tracemalloc.take_snapshot()
return jsonify(data=response), status
While trace=s1 is transferred with the call, a memory picture is selected. While trace=s2 is transferred, another image is received, and this will match with the original picture. Here we have printed the distinction, and this will determine who designated how much memory within those two calls and what is the memory leak in Python.
Hello, Memory Leak!
The result of picture difference will seem like:
/<some>/<path>/<here>/foo_module.py:65: size=3326 KiB (+2616 KiB), count=60631 (+30380), average=56 B
/<another>/<path>/<here>/requests-2.18.4-py2.py3-none-any.whl.68063c775939721f06119bc4831f90dd94bb1355/requests-2.18.4-py2.py3-none-any.whl/requests/models.py:823: size=604 KiB (+604 KiB), count=4 (+3), average=151 KiB
/export/apps/python/3.6/lib/python3.6/threading.py:884: size=50.9 KiB (+27.9 KiB), count=62 (+34), average=840 B
/export/apps/python/3.6/lib/python3.6/threading.py:864: size=49.0 KiB (+26.2 KiB), count=59 (+31), average=851 B
/export/apps/python/3.6/lib/python3.6/queue.py:164: size=38.0 KiB (+20.2 KiB), count=64 (+34), average=608 B
/export/apps/python/3.6/lib/python3.6/threading.py:798: size=19.7 KiB (+19.7 KiB), count=35 (+35), average=576 B
/export/apps/python/3.6/lib/python3.6/threading.py:364: size=18.6 KiB (+18.0 KiB), count=36 (+35), average=528 B
/export/apps/python/3.6/lib/python3.6/multiprocessing/pool.py:108: size=27.8 KiB (+15.0 KiB), count=54 (+29), average=528 B
/export/apps/python/3.6/lib/python3.6/threading.py:916: size=27.6 KiB (+14.5 KiB), count=57 (+30), average=496 B
<unknown>:0: size=25.3 KiB (+12.4 KiB), count=53 (+26), average=488 B
It sets out, and one would have a system module that we continued practicing to get downstream requests to obtain information for an answer. These system modules cancel the thread pool module to notice extracted information, such as how long it can take to make the downstream request.
And for a particular purpose, the issue of profiling could be added to the list, which might be class variable! The initial line can be 2600 KB in size, and it can do so for each incoming demand. It resembled something like that:
class Profiler(object):
…
results = []
…
def end():
timing = get_end_time()
results.append(timing)
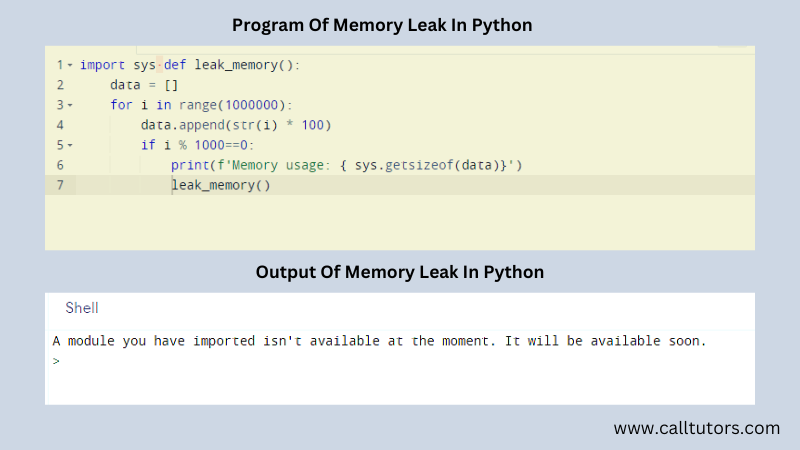
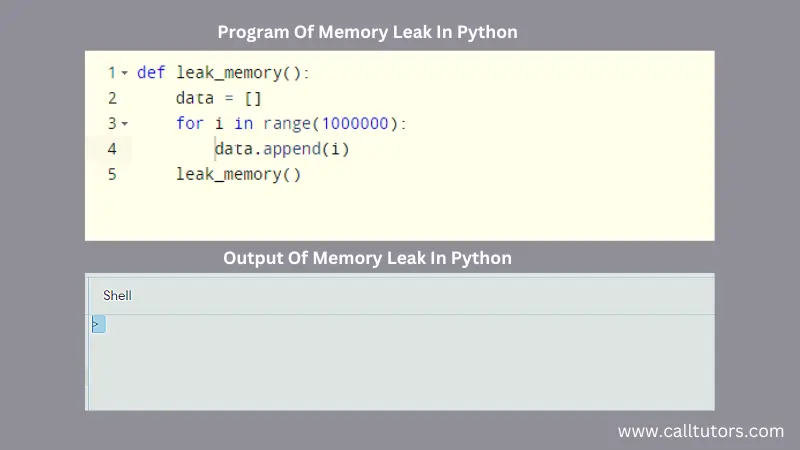
Python Memory Leak Examples
These are the two main examples of the Python Memory Leak.
1. Python Memory Leak Example

2. Python Memory Leak Example

Conclusion (Memory Leak in Python)
This article has included all the details of memory leak in Python that one can face in their program. Using coding, as mentioned above, programmers can find alternative methods to analyze the memory leaks and fix them with the help of codes. If one can recognize the leaks in the program, they can compare it with the original views. Different python memory leaks can trouble the coders in their code, so try to resolve them as soon as possible.
If you have any problem regarding python programming help and any other assignments and homework, you can ask for our experts’ help. We can provide you high-quality content along with plagiarism reports. We can also provide instant help to you as we are accessible 24*7. Besides this, we also provide the python assignments with well-formatted structures and deliver them within the slotted time. All these facilities are available at a minimal price.
FAQs
How to fix a memory leak in Python?
For it, firstly, you need to understand the term memory leak and identify its causes. Then you should use different methods to fix this issue, such as debugging methods, application of tracemalloc, etc.
What are the types of program memory?
There are four types of program memory.
Instruction
Data
Heap
Stack


